PLANT HEALTH
Grass health using Multispectral Drones on Golf Courses
Vantage Imagery provides golf courses with advanced plant health and vegetation indices services using Multispectral drone technology. These services offer detailed insights into grass health, helping Course Managers and Agronomists' make informed decisions. The technology measures various indices like NDVI (Normalized Difference Vegetation Index) to assess plant health, detect diseases, and optimise greenkeeping practices.
plant health
What is plant health?
Otherwise known as vegetation index, you can use vegetation indices to investigate several features about a plant, including the stage of its growth cycle, stress levels, or even nutrient deficiencies.
Vegetation indices are calculated according to the reflectance properties of vegetation. It’s done with multispectral imaging.
The light we can see around us is just part of a wider spectrum, where there are different wavelengths that we cannot perceive with a naked eye. How objects around us interact with that light affects how we see them. Plants reflect green light, making them green to us.
If you can look at this signature and analyze changes or deviances from the norm, you could find out about the health of a crop before your eyes even see anything on the plant.
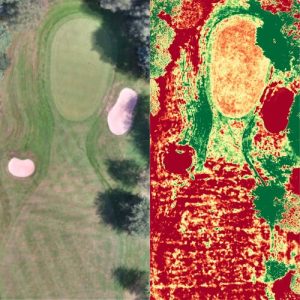
Image 1, shows an RGB image alongside the same image using a multispectral camera. With green showing healthy (high in chlorophyll) and red highlighting issues, you can clearly see the fairway is dry and damaged.
But more interestingly the green is speckled with red, this was due to a Fusarium outbreak.
-
Advanced Drone Technology
Employs state-of-the-art drones to capture Multispectral imagery for comprehensive plant health analysis.
-
Improved Grass Management
Delivers actionable insights that help course managers enhance overall grass management, leading to better surfaces.
-
Detailed Insights
Offers thorough reports and analyses, giving greenkeepers a clear understanding of their golf courses conditions and health.

Features
- Plant Health Assessment
- Early Disease Detection
- Improved Crop Management
- Detailed Insights
Some of the vegetation indices we use
Visible Atmospherically Resistant Index (VARI) – VARI works with RGB imagery rather than infrared alternatives. Simply, it detects how much greenery is present and can help detect plant stress.
Triangular Greenness Index (TGI) – The TGI looks at chlorophyll sensitivity to provide insights into nitrogen levels in leaves, which helps inform how farmers apply fertilisers.
Normalized Difference Vegetation Index (NDVI) – this is the most common vegetation index. It uses the red band of light and the near-infrared light to calculate reflectance values. The index results in providing an estimation of the amount of chlorophyll in plants. The deterioration of chlorophyll is symptomatic of a plant’s declining health, so the NDVI is critical to identifying problems early.
Green Normalized Difference Vegetation Index (GNDVI) – NDVI index without the red bands for areas sensitive to chlorophyll content.
Normalised Difference Red Edge Index (NDRE) – Sensitive to chlorophyll content in leaves with a soil background.
How it Works
Streamlined Drone Multispectral Imagery on Golf Courses
Initial discussion to understand your project
Detailed project planning, logistics and Analysis
Conduct the aerial survey using state-of-the-art Drones
Provide comprehensive reports and visuals
Multispectral Surveys
Drone Multispectral Golf Course Survey
RGB Multispectral Slider
MAP EXAMPLE
We ensure data accuracy and efficiency, offering actionable insights for your success. Discover the Vantage Imagery difference—contact us today to see how our services can benefit your project. The drone survey process can produce a 2D/3D georeferenced map or a point cloud. This is fully interactive, measurements can easily be made directly onto the map, measuring distance, area and gradient.
This shows a split screen view of a multispectral and the RGB image.
You can clearly see an under performing irrigation rotor front right and back left and right are struggling with coverage.
The yellowing on the green could be down to heat stress or lack of nitrogen but it gives the green staff the exact location of the issues to be investigated.
With a full map of your golf course you can zoom in to any part of your course. To inspect everything from plant stress, pop up irrigation performance, fertiliser applications.
Check each green individually to spot problem areas before they can be seen with the naked eye.
Check to see if your fertiliser plan needs adjusting, see if your next application is necessary and can be delayed or if they are in need of a feed.
Spot Dry Patch before it becomes a real issue.
Reduce watering cost and man hours by seeing exactly where needs water.
Features
- Identify Underperformance
- Dry Patch Detection
- Split Screen View
- Optimize Fertiliser Plans
Who Uses Multispectral Plant Health Surveys
Farmers: To monitor crop health, detect diseases, and optimize agricultural practices
Agricultural Consultants: For providing precise advice on crop management and input application
Golf Course Managers: To assess turf health, identify stress areas, and manage irrigation effectively.
Agribusinesses: To enhance productivity and sustainability through data-driven insights