 Skip to main content
A fairway can look uniformly green from the clubhouse while already carrying early signs of water stress, nutrient imbalance or disease pressure. That is why multispectral imagery versus NDVI is not simply a technical comparison. For golf course managers and greenkeeping teams, it determines whether aerial data reveals a useful management priority or merely produces an attractive colour map.
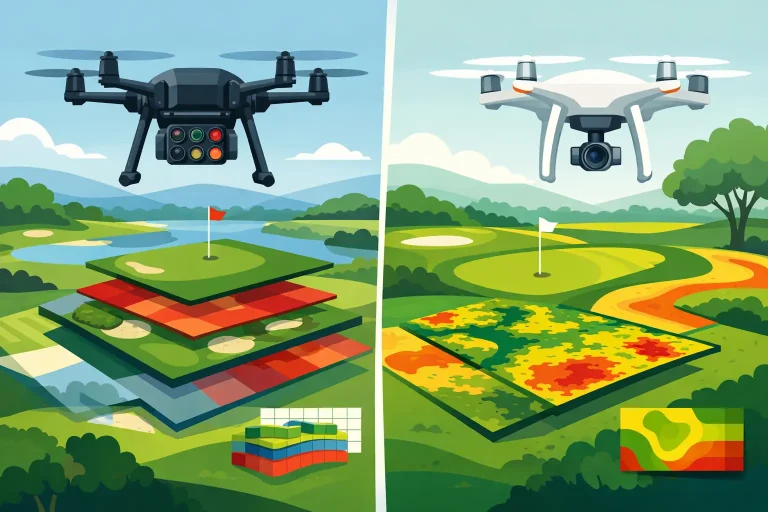
The key distinction is straightforward. Multispectral imagery is the measured data captured by a specialist sensor across several light bands. NDVI is one calculation produced from part of that data. Both have a place in precision turf management, but they answer different questions and should not be treated as interchangeable.
Multispectral imagery versus NDVI: the core difference
Multispectral imagery records reflected light beyond the visible spectrum. A drone-mounted sensor commonly captures blue, green, red, red-edge and near-infrared light. Healthy vegetation reflects these bands in recognisable ways, particularly strong near-infrared reflectance from healthy leaf structure and lower red reflectance where chlorophyll is active.
A multispectral survey therefore creates a set of spatial datasets, one for each spectral band. When processed correctly, these can be turned into calibrated reflectance maps, plant-health indices, management zones and comparisons over time. It is the wider evidence base.
NDVI, or Normalised Difference Vegetation Index, uses near-infrared and red bands to estimate vegetation vigour. Its value typically ranges from -1 to +1. Higher values generally indicate more active, denser vegetation, while lower values can highlight thin turf, bare ground, stressed areas, paths, water or other non-vegetated surfaces.
NDVI is valuable because it makes variation visible at scale. A superintendent can quickly identify a weak strip through a fairway, an inconsistent irrigation pattern around greens, or rough that is responding differently to a treatment programme. Yet it remains an index, not a diagnosis. It indicates that an area warrants attention, not precisely why the turf is underperforming.
Why the difference matters on a golf course
Golf courses contain a complex mix of finely managed surfaces. Greens, tees, approaches, fairways, rough, woodland margins and water features all reflect light differently. Even within one fairway, soil type, shade, compaction, traffic, drainage and irrigation coverage can alter the result.
Using NDVI alone may show a low-vigour area, but it cannot reliably separate drought stress from pest damage, poor drainage, wear, nutrient deficiency or a recent change in mowing practice. Ground inspection remains essential. The practical value comes from using the map to direct the inspection team to the right place, sooner.
Multispectral imagery provides more options for investigating the pattern. Reviewing individual bands and applying alternative indices can help distinguish between dense healthy canopy, sparse cover and subtler chlorophyll changes. The red-edge band is particularly useful in managed turf because it can retain sensitivity where NDVI begins to level off in dense, healthy vegetation.
This is relevant on intensively maintained greens and fairways. NDVI can saturate when vegetation is already thick and green, making meaningful differences harder to detect. An NDRE, or Normalised Difference Red Edge index, may reveal variation that standard NDVI masks. The correct index depends on the turf condition, the sensor, the season and the question being asked.
What NDVI does well
NDVI is often the most accessible starting point for regular turf-health monitoring. It produces a clear visual layer that can be compared with irrigation layouts, drainage plans, topographical mapping and historic site information.
For a golf course, NDVI is particularly effective for identifying broad patterns such as uneven fairway performance, recurring dry areas, declining rough cover, construction disturbance or vegetation encroachment. When surveys are repeated at comparable times of year, it can also show whether a pattern is becoming more pronounced or whether remedial work is delivering the intended result.
It is a strong communication tool as well. A colour-coded map gives course managers, committees, consultants and contractors a shared view of the issue. That makes it easier to explain why a drainage investigation, irrigation adjustment or targeted aeration programme has been prioritised.
The limitation is that NDVI should not be used as a standalone prescription. A low value does not automatically mean water is required. Applying additional irrigation to an area affected by poor drainage, disease or shade could increase cost and worsen the problem.
When multispectral analysis adds greater value
A multispectral survey becomes more valuable when decisions need to be more specific than identifying good and poor vegetation. This is usually the case where there is a persistent issue, a significant irrigation investment, a drainage project, a course renovation or a need to evidence change over time.
The quality of the capture and processing also matters. Raw drone imagery can be influenced by cloud cover, changing light, sensor settings and viewing angle. For meaningful comparison between dates, imagery should be collected with a suitable calibrated sensor and reflectance panel, then processed consistently. Otherwise, an apparent change in turf condition may partly be a change in survey conditions.
Survey-grade positioning strengthens the operational use of the output. When multispectral layers align accurately with topographical data, irrigation heads, drainage runs, utilities and design plans, teams can move from broad observation to targeted field action. Instead of treating an entire fairway, they can inspect a defined area and relate it to known infrastructure or ground conditions.
This is where precision aerial data produces measurable value. The image is not the final deliverable. The value lies in connecting vegetation response with the physical systems that influence it.
A practical example: investigating dry fairway areas
Consider a fairway that repeatedly browns off in dry weather. An NDVI map may show several low-vigour zones, including one narrow strip that follows the line of play. That finding is useful, but not enough to specify a remedy.
A broader multispectral analysis, combined with an accurate terrain model and irrigation overlay, may show that the strip sits on a local rise, outside the effective throw of nearby heads, with lighter soil and rapid run-off after watering. The management response can then focus on nozzle performance, coverage, scheduling and soil-moisture verification rather than applying more water across the full fairway.
The same approach can identify the opposite condition. A persistently weak patch may align with a low point, suggesting compaction, waterlogging or drainage restriction rather than drought. The aerial data narrows the investigation. Site knowledge and physical checks confirm the cause.
Choosing the right approach
The choice is not usually multispectral imagery or NDVI. NDVI is one of the most useful outputs from multispectral data, especially for clear first-pass monitoring. The decision is whether the project requires only a simple vegetation-vigour view or a deeper, repeatable analysis that supports operational planning.
A one-off visual review may suit NDVI where the aim is to locate obvious inconsistency across large areas. A calibrated multispectral programme is better suited to high-value turf, irrigation optimisation, renovation planning, recurring stress patterns or before-and-after reporting. Golf courses that already hold accurate mapping gain further benefit because vegetation results can be integrated with the assets and terrain that affect performance.
Timing is equally significant. Flights should be planned around the management question, not simply around drone availability. Surveying before visible stress becomes widespread can reveal developing issues. Capturing the same areas after works or through a dry period creates a more useful record than isolated imagery collected without a baseline.
Turning aerial data into field decisions
The best workflow combines aerial analysis with greenkeeping expertise. First, establish the objective: identify irrigation shortfalls, assess renovation progress, investigate recurring turf stress or monitor wider land management. Then capture suitable imagery under controlled conditions and process it into outputs that match the decision required.
The resulting maps should be reviewed alongside irrigation plans, drainage information, soil data, maintenance records and local knowledge. A targeted ground-truthing visit then checks representative high- and low-value areas. This avoids treating spectral variation as proof of a single cause.
For commercial golf operations, this process supports better allocation of labour, water, materials and contractor spend. It also creates clear evidence for capital planning. Rather than relying on broad assumptions about where a system is underperforming, teams can base discussions on accurately located patterns and repeatable data.
Vantage Imagery Limited approaches plant-health surveys as part of a wider precision mapping service. The aim is to provide golf professionals with clear, accurate outputs that can be used alongside irrigation, drainage and course-management information, rather than delivering imagery with no operational context.
A healthy-looking course can still contain early warnings that are invisible from ground level. Use NDVI to spot the pattern, use multispectral data to investigate it properly, and use experienced on-course assessment to decide what happens next.
