
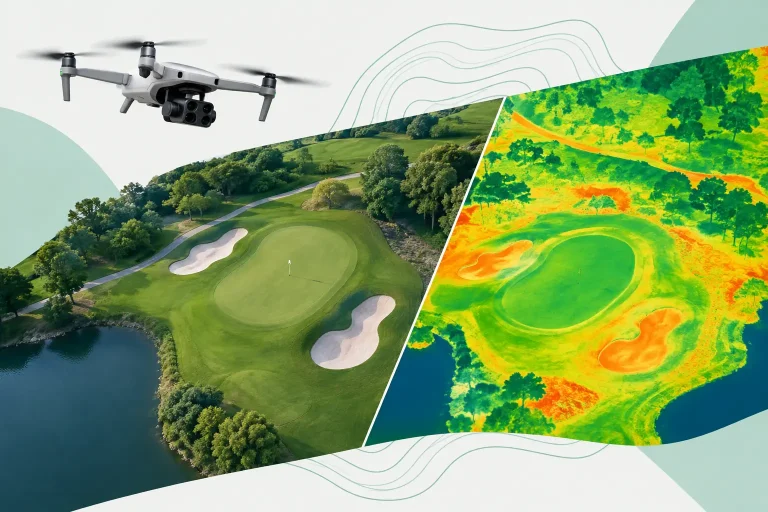
Aerial photographs can make a golf course look immaculate while concealing early turf stress across a green, approach or fairway. That is the practical difference at the heart of NDVI versus RGB imagery: RGB shows what the eye can see, while NDVI helps reveal variation in vegetation vigour before it becomes an obvious visual issue.
For course managers, greenkeepers and consultants, the question is not which dataset is universally better. It is which one provides the evidence needed for the decision in front of you. A high-resolution RGB orthomosaic may be the right tool for locating a damaged drainage run or planning bunker works. A calibrated NDVI survey may be far more useful when investigating unexplained dry patches, irrigation performance or uneven turf response at scale.
NDVI versus RGB imagery: the essential difference
RGB imagery records reflected red, green and blue light – the same visible spectrum seen by the human eye. A drone carrying an RGB camera can produce detailed aerial photographs, orthomosaics and three-dimensional models. On a golf course, this gives teams a clear, current view of features, assets and surface condition.
NDVI, short for Normalised Difference Vegetation Index, is calculated using red and near-infrared light. Healthy, actively growing vegetation absorbs much of the red light for photosynthesis and reflects a high proportion of near-infrared light. The resulting index presents relative vegetation response, commonly using a colour scale that highlights stronger and weaker areas of growth.
This distinction matters. RGB imagery is visual evidence. NDVI is a calculated vegetation indicator. One should not be treated as a replacement for the other.
An RGB survey can show a visibly brown area, wheel marks, standing water, bare soil, tree canopy and the precise position of an irrigation head. NDVI can identify subtle inconsistency in plant response across a turf surface that still appears broadly green from ground level or in standard aerial photography. Used together, they provide a more complete operational picture.
What RGB imagery does best on a golf course
RGB remains the most versatile aerial dataset for everyday site understanding. Captured at high resolution, it can create a current photographic map of the entire course, giving management teams an accessible base layer for maintenance planning, project scoping and communication.
Its greatest strength is detail that everyone can interpret quickly. A course manager can identify a worn traffic route beside a tee; an irrigation contractor can see valve boxes, sprinkler locations and trench routes; a golf architect can assess bunker shape, contour expression and tree encroachment. When processed through photogrammetry, RGB imagery can also support centimetre-accurate topographical mapping where suitable survey control and flight methodology are used.
That makes RGB particularly valuable for drainage planning, renovation works, utility mapping, construction progress monitoring and records of visible course assets. It is also the preferred dataset when presentation matters, such as communicating planned work to a committee or producing promotional photography.
However, RGB has a limit. It represents appearance, and appearance can be misleading. Fine turf may look green while experiencing rootzone moisture variation, nutrient stress, compaction or early disease pressure. Lighting conditions can also change perceived colour. A bright, low-angle winter sun or deep shade beside mature trees can affect an image without reflecting a material change in turf health.
Where NDVI provides greater value
NDVI is most effective when the aim is to compare vegetation response across a defined area and target investigation efficiently. On a golf course, that may mean assessing fairway drought stress, reviewing the performance of an irrigation zone, monitoring recovery after overseeding, or identifying areas affected by drainage or compaction issues.
Rather than asking a team to inspect every square metre of a long fairway, an NDVI map can direct attention to the areas that differ from their surroundings. This supports more intelligent ground-truthing. The map identifies a pattern; the greenkeeping team then verifies the likely cause through on-site inspection, moisture readings, irrigation checks and agronomic knowledge.
A recurring low-NDVI strip along a fairway may correspond with a poorly performing irrigation line, shallow soil, a drainage issue or historic compaction. A weak patch on a green surround may reveal inconsistent water delivery or reduced plant vigour before the contrast is clear in RGB imagery. The value lies in prioritising action, not in treating the index as a diagnosis on its own.
For larger sites, repeat NDVI capture can be especially useful. A single survey provides a snapshot. Surveys undertaken at comparable points in the growing season create a more meaningful record of change. This enables management teams to assess whether renovation work, irrigation adjustments or drainage interventions are producing the intended result.
NDVI is not a turf-health verdict
NDVI is powerful, but it has constraints that need to be understood before decisions are made. It measures spectral response, not soil moisture, disease type, nutrient levels or root depth directly. A low value signals that an area behaves differently from the surrounding turf. It does not explain why.
Fine turf also presents particular challenges. Closely mown surfaces, mixed grass species, sand, exposed soil, shade and surface moisture can all influence NDVI readings. A newly top-dressed green, for example, may show a changed response because sand is visible between plants, even where the turf is performing as expected.
NDVI can also become less sensitive where vegetation is already dense and healthy. This is known as saturation. In practical terms, two areas of vigorous grass may receive very similar values even if one is marginally stronger than the other. For some turf assessments, other multispectral indices or complementary data may provide more useful differentiation.
Capture quality is equally important. A useful NDVI survey requires an appropriate multispectral sensor, consistent flight planning and sound radiometric processing. Changes in sunlight, cloud cover and sensor settings can compromise comparisons between dates if they are not controlled properly. For repeat monitoring, consistency in timing, altitude, calibration and processing method is essential.
Accuracy has two meanings
Clients often ask whether NDVI imagery is accurate. The answer depends on what type of accuracy is being discussed.
Spatial accuracy concerns whether a mapped feature is in the correct location. This is critical when imagery will be overlaid with irrigation plans, drainage records, utilities or topographical data. RTK positioning and properly established ground control can improve confidence in the location of survey outputs.
Spectral consistency concerns whether the recorded vegetation values can be compared reliably. This relies on sensor capability, calibration, light conditions and processing discipline. A visually striking colour map without these controls may still be unsuitable for repeatable monitoring or operational decisions.
The strongest projects address both. Vantage Imagery combines precision-led aerial mapping with multispectral analysis so that vegetation patterns can be reviewed alongside the physical infrastructure and topography that often explain them.
Choosing the right dataset for the question
Start with the management question rather than the camera. If the requirement is to map visible features, plan works, document site condition or generate a detailed base map, RGB imagery is normally the logical first choice. It is accessible, highly detailed and useful across numerous operational tasks.
If the requirement is to understand variable turf response across a large area, identify priority inspection zones or monitor change through the season, NDVI can add a valuable analytical layer. It is particularly effective where a pattern is suspected but not yet clearly visible from ground level.
In many cases, the best answer is a combined survey. RGB provides the context: bunkers, paths, trees, irrigation hardware, drainage features and visible surface condition. NDVI adds a layer of vegetation performance. When these datasets are reviewed against topography and known irrigation or drainage layouts, the course team can move from a vague concern to a targeted investigation.
For example, an NDVI map may reveal repeated weak response on the high side of several fairways. An RGB orthomosaic and elevation model may then show that the affected ground is exposed, free-draining and distant from effective sprinkler coverage. The resulting action could be an irrigation audit, targeted aeration, amended wetting-agent programme or a drainage review. The imagery has not replaced professional judgement – it has made that judgement faster and better informed.
Turning aerial data into practical action
The most useful deliverable is not simply an attractive image or colour-coded map. It is imagery supplied at a resolution, coordinate system and format that supports the people managing the land. That may mean a georeferenced orthomosaic for a course-management platform, a vegetation map aligned with irrigation zones, or marked areas for field inspection.
Before commissioning a survey, establish the areas of concern, the decisions that follow from the results and whether the project needs a one-off assessment or repeat monitoring. This determines whether RGB, NDVI or a combined approach will deliver measurable value.
A good aerial survey should leave the course team with a clearer next inspection, a better-targeted maintenance plan and reliable evidence for investment decisions. That is where NDVI and RGB imagery earn their place: not as competing visuals, but as complementary tools for managing turf and infrastructure with greater precision.