 Skip to main content
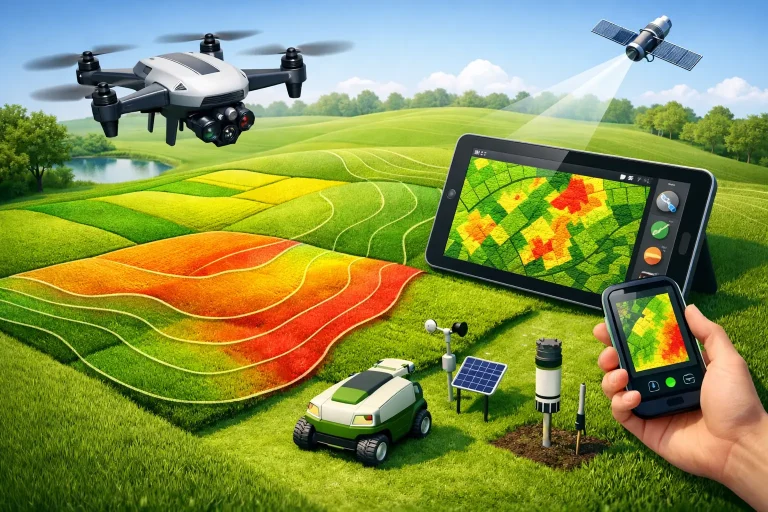
A fairway can look healthy from the clubhouse and still be under pressure. By the time thinning turf, drought stress or uneven colour are clear at ground level, root-zone conditions may already be affecting recovery and playing quality. Crop health monitoring gives course teams an earlier, more consistent view of where turf requires attention – before a small issue becomes a visible scar across a playing surface.
For golf courses, the value is not simply an attractive aerial image. The objective is decision-ready evidence: accurate maps that identify patterns in turf vigour, support targeted inspections and help managers direct labour, water and treatment where they will make the greatest difference.
What crop health monitoring shows on a golf course
Crop health monitoring uses aerial imagery, particularly multispectral data, to measure how vegetation reflects different wavelengths of light. Healthy, actively growing turf reflects light differently from stressed, sparse or diseased vegetation. Specialist processing turns those differences into clear vegetation-health maps.
A commonly used output is an NDVI map, which compares near-infrared and visible red light to indicate relative plant vigour. On a golf course, it can reveal variation across fairways, rough, practice areas and managed landscapes that is difficult to identify during a routine visual inspection. Other indices may be selected where chlorophyll response, moisture-related stress or bare-ground contrast needs closer attention.
The map does not diagnose every issue on its own. A low-vigour area may be linked to irrigation coverage, compacted ground, shade, poor drainage, pest activity, nutrient availability, traffic or a combination of factors. Its strength is in showing precisely where to investigate first and how extensive the pattern is.
Why visual inspection alone has limits
Experienced greenkeepers know their course intimately. Their observations remain essential, particularly when assessing disease symptoms, surface firmness, rooting depth and the local conditions that influence turf performance. The challenge is scale and timing.
A 100-acre course contains thousands of subtle changes, many of which develop between walkovers. Stress can follow a drainage line, appear at the edge of an irrigation zone or spread across a slope in a way that is hard to recognise from the ground. Aerial crop health monitoring places the whole site in one consistent view, allowing teams to compare areas without relying on memory or isolated spot checks.
It also creates a repeatable baseline. Rather than asking whether a fairway looks slightly weaker than last month, managers can compare maps captured at similar stages of the season and under controlled survey conditions. That makes it easier to separate a temporary weather response from a recurring operational problem.
Turning multispectral data into practical action
The useful part of a plant-health survey begins after the flight. Maps should be aligned with accurate course mapping, irrigation layouts, drainage records and known maintenance zones. This context converts colour variation into an operational task list.
For example, a low-vigour strip alongside a fairway may correspond with a blocked lateral drain. A repeating pattern around sprinkler heads may point to distribution or pressure issues. A weaker section near mature trees could indicate persistent shade and root competition rather than a need for more fertiliser. Each finding leads to a more focused ground inspection and a more defensible decision.
Where irrigation infrastructure is mapped, vegetation data can be especially valuable. Course teams can compare turf response with head locations, pipe routes and watering zones, then prioritise adjustments or repairs where the evidence supports them. This reduces the risk of treating symptoms across an entire fairway when the underlying issue is localised.
Target inputs instead of broad responses
Applying water, nutrition or treatment uniformly is sometimes appropriate, but it is not always efficient. Multispectral mapping can identify relative variation so that a greenkeeping team can inspect and respond by zone. The result may be a targeted irrigation adjustment, aeration in a compacted area, a drainage investigation or a change in mowing and traffic management.
The commercial benefit is greater control over resources. Inputs can be directed to verified areas of need, while healthy turf is not subjected to unnecessary intervention. For clubs managing rising water, labour and material costs, that distinction matters.
Build evidence for capital works
Crop health data is also useful beyond daily maintenance. Repeated weak areas can provide visual evidence when planning drainage works, irrigation upgrades, bunker renovation or tree management. Consultants, architects and committees can review the same mapped information rather than relying on a series of anecdotal observations.
This is particularly effective when multispectral outputs are paired with centimetre-accurate topographical data. Surface levels, flow paths and vegetation response can then be considered together. A weak area at the base of a slope may have a very different cause from one on a dry ridge, even where both present as low vigour on a map.
Capture conditions matter as much as the sensor
A multispectral sensor is only one part of a reliable survey. Meaningful crop health monitoring depends on repeatable flight planning, appropriate calibration, accurate georeferencing and careful interpretation. Flights should be scheduled with the purpose of the survey in mind, not simply whenever the weather permits.
Recent mowing, irrigation, rainfall, frost, dew, seasonal growth stage and cloud conditions can all influence the reading. A single survey is valuable for locating current anomalies, but a programme of comparable captures is far more useful for identifying change. On a golf course, the best interval depends on the management question. A period of dry weather may justify closer monitoring, while strategic seasonal captures may be sufficient for longer-term drainage or irrigation planning.
Data should also be checked against observations on the ground. If a map indicates low vigour, inspect the area before prescribing a remedy. This protects against incorrect assumptions and allows the course team to add the operational knowledge that imagery cannot see, such as recent works, known pipe failures or changes in traffic.
Choosing outputs your team can use
The most technically sophisticated dataset has limited value if it cannot be used by the people managing the course. A practical deliverable should make it easy to locate areas of concern, understand the scale of variation and share findings with contractors or consultants.
For most projects, this means a high-resolution orthomosaic, vegetation-index maps, annotated areas for inspection and clear comparison with existing course features. Where required, data can be supplied to support irrigation planning, CAD workflows or wider course-management records. The appropriate format depends on whether the immediate requirement is a superintendent’s inspection route, a consultant’s report or a capital-project specification.
Vantage Imagery Limited approaches aerial data as a working tool for course operations, not a generic visual product. Combining certified drone operations with precision mapping allows turf-health findings to sit alongside the physical infrastructure and terrain that shape how a course performs.
When drone-based monitoring delivers the strongest return
The technology is most effective when there is a clear management question. It may be an unexplained decline in a fairway, a suspected irrigation coverage issue, recurring drought stress, the need to prioritise drainage investment or a requirement to document conditions before and after works.
It is less useful as a one-off exercise with no plan to inspect findings or compare results over time. The return comes from acting on the information. Set the objective before the survey, involve the people responsible for irrigation and turf management, and agree how anomalies will be verified on the ground.
A course does not need to react to every colour change on a map. It needs clear evidence of where attention is likely to produce a better outcome. Used in that way, crop health monitoring gives greenkeeping teams a sharper view of the ground beneath their feet – and a stronger basis for protecting turf quality, controlling costs and planning with confidence.
