A fairway can look consistent from the clubhouse and still conceal a drainage route, worn traffic line or irrigation issue that affects daily maintenance decisions. A guide to drone orthomosaic maps is therefore not simply about aerial photography. It is about turning a complete site capture into a measured, reliable visual record that golf course teams can use with confidence.
Unlike a standard overhead drone image, an orthomosaic map is processed to correct perspective and terrain distortion. The result is a high-resolution image that can be viewed, measured and overlaid with operational information. For golf clubs, estates and construction sites, that difference determines whether aerial data is merely attractive or genuinely useful.
What is a drone orthomosaic map?
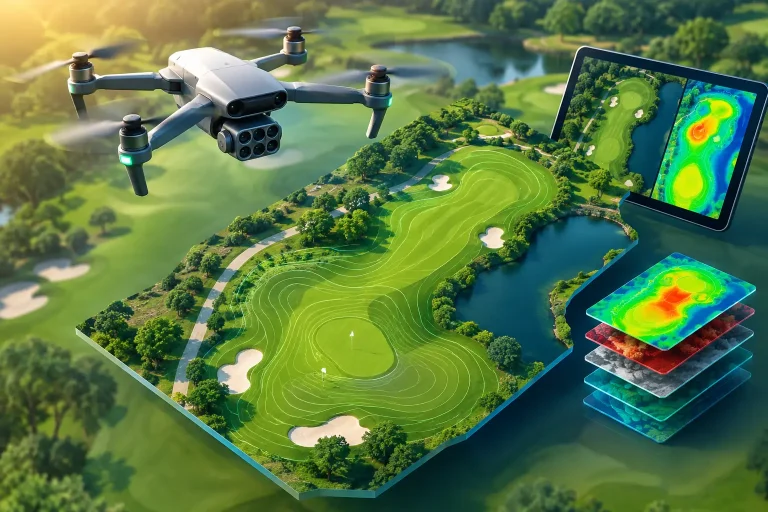
A drone orthomosaic is a single, geographically accurate map created by stitching together a large number of overlapping aerial photographs. Specialist photogrammetry software identifies matching points across the images, aligns them and corrects the geometry so that the final output has a consistent scale.
The word “ortho” matters. A conventional aerial photograph is affected by camera angle, lens characteristics and changes in ground level. Features towards the edge of an image may appear displaced, while taller objects can lean away from the centre. An orthomosaic corrects these effects, allowing features on the map to be positioned accurately in relation to one another.
When a survey is supported by ground control points or RTK positioning, the map can achieve centimetre-level accuracy appropriate for many planning, asset management and design applications. The achievable accuracy depends on the equipment, site conditions, flight specification and control methodology. A drone alone does not automatically make a survey-grade map.
Why orthomosaic mapping matters on a golf course
Golf courses are complex operational landscapes. Greens, bunkers, tees, fairways, rough, paths, water features, woodland, irrigation infrastructure and drainage systems all occupy the same site, often across substantial acreage. Managing them from fragmented plans, memory and occasional walkovers can slow decisions down.
An orthomosaic gives the entire course team a current, consistent view of the property. A greenkeeper can review surface patterns around a green complex; an irrigation specialist can trace likely pipe routes alongside valve locations; a course architect can assess bunker positions, shaping and circulation before preparing design proposals. The map establishes a shared visual reference, reducing ambiguity between stakeholders.
It is particularly valuable where records have become outdated. Many clubs hold legacy drawings that do not reflect later alterations, repaired drainage, redesigned holes or changes to maintenance compounds. A new aerial base map does not replace every underground record, but it provides an accurate framework for bringing information together.
From image to operational layer
The greatest value comes when the orthomosaic is used as a working layer rather than saved as a static image. Irrigation heads, valves, hydrants, drains, manholes, outfalls, trees, paths and utility routes can be marked over the aerial base. This creates a clearer record of where assets are and how they relate to visible course features.
For irrigation planning, that clarity can support more efficient fault finding and maintenance scheduling. Teams can identify isolated areas, understand access routes and discuss proposed upgrades against an accurate plan. For drainage investigations, aerial patterns may help establish where water is collecting or where previous works have altered the ground.
The map is also a practical communication tool. Explaining a renovation scheme to a committee, consultant or contractor is easier when everyone can see the same course layout at an appropriate scale.
How a drone orthomosaic survey is produced
A reliable orthomosaic begins before the drone leaves the ground. The survey brief should define what decisions the data needs to support. A promotional image, a broad asset overview and a topographical planning survey each require different levels of detail, accuracy and processing.
The first step is flight planning. The drone follows a structured grid or double-grid pattern, capturing images with sufficient forward and side overlap. Flying height is selected according to the required ground sampling distance, site size, airspace restrictions and the level of visible detail required. Lower flights produce more detail but generate more images, longer processing times and larger data files.
Ground control points are then placed and measured where survey-grade positional confidence is required. These clearly marked targets link the drone imagery to known coordinates on the ground. RTK or PPK-equipped drones can improve geotagging accuracy, but independent ground control remains valuable for validation and for demanding mapping projects.
After the flight, images are checked for sharpness, exposure and coverage before photogrammetry processing begins. The software aligns photographs, creates a dense point cloud and generates an elevation model. It then orthorectifies the imagery against the terrain model and produces the final stitched map.
Quality assurance is not an optional final click. Control points, check points, joins between images and areas around trees, buildings and steep banks should be reviewed carefully. Golf courses can present particular challenges: mature woodland creates shadows, water surfaces offer few reliable matching points, and wind movement can affect flags, branches and long grass.
What accuracy can you expect?
Accuracy should always be discussed in context. A visually impressive map may still be unsuitable for setting out construction works or designing precise levels. Equally, a highly controlled survey can be more than is needed for a broad management overview.
For a properly planned drone survey using suitable ground control, centimetre-level horizontal accuracy is often achievable. Vertical accuracy is usually more sensitive to terrain, vegetation, flight height and processing settings. If the brief includes contours, cut-and-fill calculations, drainage gradients or detailed design work, a topographical deliverable should be specified from the outset.
It is also worth separating resolution from accuracy. Resolution describes the amount of visible detail, such as a few centimetres per pixel. Accuracy describes how closely a mapped feature corresponds to its real-world location. A map can be high resolution and still be incorrectly positioned if it has not been controlled and checked.
A practical guide to drone orthomosaic maps: choosing the right output
The final map should fit the task, not the other way round. For routine golf course management, a high-resolution orthomosaic with labelled assets may be the most useful deliverable. For irrigation renewal, drainage planning or course redevelopment, it may need to sit alongside CAD-ready data, contours, spot levels and a digital terrain model.
Common outputs include a georeferenced orthomosaic, a PDF plan for meetings and print use, GIS-compatible files and an online viewing environment for internal teams. The best format depends on who needs access to the information and what systems they already use.
Before commissioning a survey, establish four practical points:
- the decisions the map will support, from asset recording to redesign or construction planning;
- the required positional accuracy and whether ground control is necessary;
- the features to be identified or overlaid, including irrigation, drainage, utilities and maintenance infrastructure;
- the preferred file formats and whether the data must integrate with existing mapping, CAD or irrigation management systems.
This early clarity prevents a common problem: receiving a beautiful aerial image that cannot be measured reliably, shared effectively or used in the software that matters to the business.
Limits to understand before relying on the map
Orthomosaic maps are powerful, but they do not see through vegetation, water, buildings or soil. A drainage line covered by dense rough will not become visible simply because it has been flown over. Underground utilities must be identified from verified records, site investigation or appropriate detection methods, then added to the map with suitable confidence information.
Tall objects and complex structures can also create local artefacts. Tree canopies, clubhouse roofs and bridge structures may appear imperfect where the software has limited visibility of the ground beneath them. These areas need interpretation, particularly when measurements are being taken close to vertical features.
Seasonality matters too. A winter capture can reveal ground shape and drainage indicators more clearly where vegetation is sparse, while a summer capture may be better for assessing turf condition and presentation. There is no universally correct survey date. The right timing depends on the problem being investigated.
Turning aerial data into better decisions
The strongest orthomosaic projects start with an operational question. It might be where to prioritise drainage expenditure, how to document an irrigation system, how to plan a bunker renovation or how to monitor a construction programme without repeated site disruption.
At Vantage Imagery Limited, the focus is on producing precision aerial data that can be applied to those decisions, rather than delivering generic drone imagery. For a golf course, that means considering the map alongside the daily realities of turf care, water management, access, infrastructure and future investment.
A current orthomosaic map will not replace professional judgement on the ground. It gives that judgement a more accurate base, a clearer record and a practical way to coordinate action. When the next drainage concern, irrigation fault or development proposal arises, the course team can start from measured evidence rather than an outdated plan.